DATA VISUALIZATION

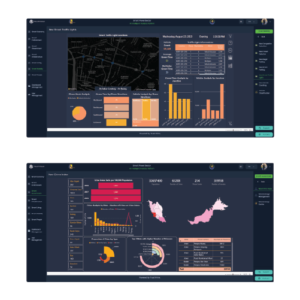
Trust Prime is a cutting-edge data visualization platform that stands at the forefront of transforming raw data into actionable insights. With its user-friendly interface and robust set of features.

Trust Prime empowers organizations to unlock the true potential of their data. This platform not only simplifies the process of data visualization but also provides a comprehensive toolkit for analyzing, interpreting, and presenting data in a compelling and informative manner. Trust Prime’s dynamic capabilities allow users to effortlessly create interactive charts, graphs, and dashboards, enabling them to make well-informed decisions backed by real-time data.

Whether you’re a data analyst, business leader, or anyone in between, Trust Prime is the trusted companion for harnessing the power of data to drive innovation, efficiency, and success across all sectors and industries.

  • Streamlined Data Analysis

    Trust Prime simplifies data analysis, enabling users to extract valuable insights efficiently, saving time and resources.

  • Interactive Visualizations

    Create engaging, interactive charts and graphs that enhance data understanding and facilitate informed decision-making.

  • Real-time Insights

    Access up-to-the-minute data, allowing for agile responses to changing circumstances and a competitive edge in decision-making.

  • User Empowerment

    Trust Prime puts data in the hands of non-technical users, democratizing data-driven decision-making across the organization.

  • Enhanced Collaboration

    Foster teamwork by sharing and collaborating on data visualizations, ensuring everyone is on the same page for better outcomes.

Trust Prime

Illuminating Data for Informed Decisions and Boundless Insights.

Doughnut

Doughnut charts closely resemble pie charts but feature a ring-like shape rather than a traditional pie shape.

Radial Gauge

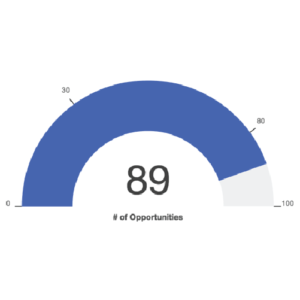
Radial gauges visualize KPIs using partially filled gauges, akin to automobile dashboards, displaying associated goals.

Data Explorer

Accessible data exploration aids data review before configuring analytical processes, simplifying the initial stages.

Bar Chart

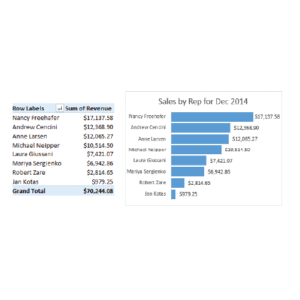
A robust and straightforward data visualization tool, use one axis for categories and the other for values, displaying a bar for each data point.

Column Chart

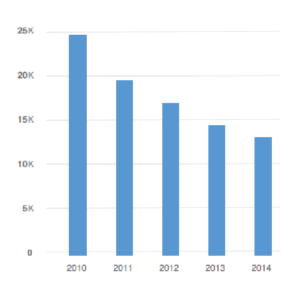
A column chart presents data vertically, like bars, distinguishing it from a traditional horizontal bar chart.

Stacked Column

Stacked column charts mirror Stacked Bar charts, yet bars are vertically stacked for presentation distinction.

Stacked Bar

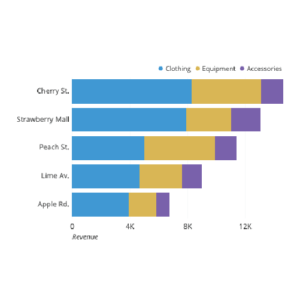
Stacked bar charts depict various data categories, with each value stacked atop the preceding category.

100% Stacked Bar

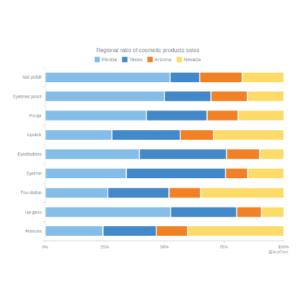
These function similarly to Stacked Bar charts, but bars have uniform value, displaying multiple category proportions.

100% Stacked Column

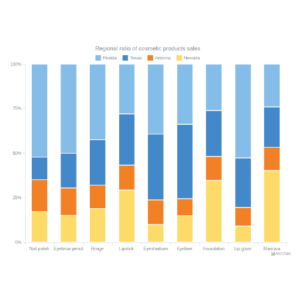
Similar to the 100% Stacked Bar, each bar is presented in a vertical orientation.

Grid

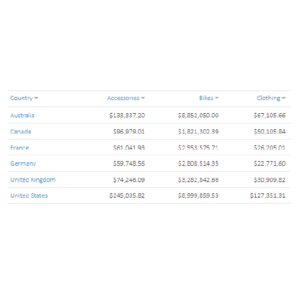
The grid control showcases tabular data with features like paging, filtering, sorting, and displaying summary information.

Pivot Grid

The Pivot grid displays data in grouped format, enabling column and row axis grouping and summarizing data.

Map

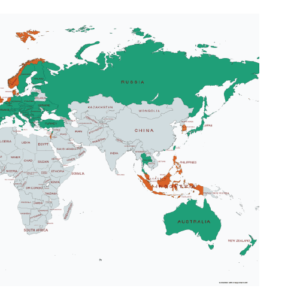
The Map control lets you use color to represent numeric values for geographic entities, like sales per state.

Bing Maps

Bing Maps control loads visually appealing maps powered by Bing and displays data using latitude and longitude.

Tree Map

The Tree Map control visually organizes hierarchical data using rectangles to represent tree nodes in detail.

Heat Map

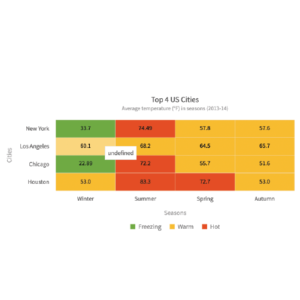
Heat Map control displays colored areas representing data across two dimensions for clear visualization.

Number Card

The number control widget presents single or multiple values, allowing labeling with text or images.

Range Slider

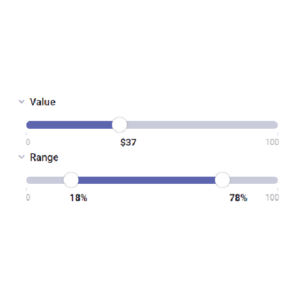
Range sliders enable intuitive selection of value ranges and are used to apply data filters efficiently.

Range Navigator

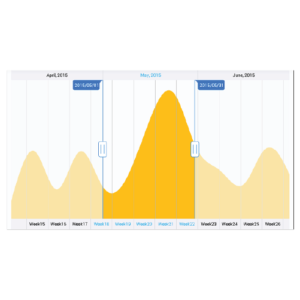
The Range Navigator control lets users define a subset within a larger range, serving as an intuitive filter.

Pyramid

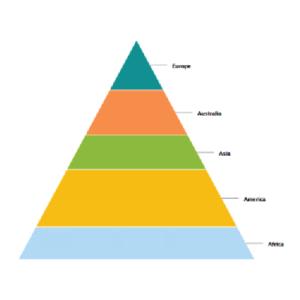
Pyramid charts represent proportional values, with lower values positioned at the base and higher values at the apex.

Funnel

Funnel charts highlight process segments at different stages, commonly showcasing progression or conversion dynamics.

SOURCE

DATA CONNECTIVITY

To achieve the utmost success in analytics deployment, it’s essential to establish seamless connectivity with a wide spectrum of business data sources. Trust Prime, meticulously designed in accordance with the latest industry standards, excels in simplifying data integration, enabling a truly effortless and effective process.

Support for data files such Excel, csv

Trust Prime offers robust support for various data file formats, including Excel and CSV files.

Relational databases

Connect to data in widely used relational data stores like SQL Server, Oracle, Postgres, MySQL, MariaDB, and beyond.

NoSQL Databases

Retrieve data from well-known NoSQL databases like MongoDB, Elasticsearch, and InfluxDB with ease and efficiency.

Big Data integration

Effortlessly connect to data within Big Data ecosystems, including Hadoop and Spark platforms, for comprehensive analysis.

Data warehouse

Establish direct connections to data warehousing solutions like Amazon Redshift, Google BigQuery, Azure SQL Data Warehouse, and others.

REST API Services

Retrieve data from sources through REST APIs with seamless accessibility and integration capabilities.

CONTROL

FULLY MANAGEABLE

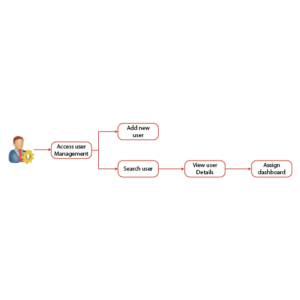
“Manageable” within Trust Prime signifies a powerful and user-centric feature that grants users the ability to take control of their digital landscape. With this capability, administrators can efficiently manage users, with the flexibility to add, remove, and search for users within the system. Moreover, it extends to the management of dashboards, allowing administrators to effortlessly assign dashboards to users as needed. This feature not only streamlines user and dashboard administration but also enhances collaboration and customization, ensuring an optimized experience within the Trust Prime platform.

User Management

Seamlessly add or remove users and assign / unassign dashboards to users in your organization as per your subscription allocation.

Role based Access

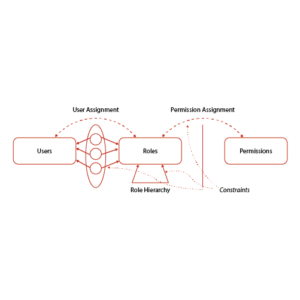
Trust Prime employs role-based access, distinguishing between administrators and staff, each with specific access levels to safeguard data confidentiality and security.

Customized Dashboards

Experience personalized dashboards within Trust Prime, thoughtfully crafted to match your specific requirements and objectives for enhanced usability.

SECURITY

PROTECTING WHAT MATTERS MOST

We place data security at the forefront of our concerns. Trust Prime, designed with your protection in mind, seamlessly integrates with your data while maintaining stringent security protocols.

Unified Sign-In

When utilizing Trust Prime, you can effortlessly integrate your existing security infrastructure, ensuring seamless compatibility and enhanced protection for your data.

Your Data, Your Control

With Trust Prime, your data remains exclusively within your control. You can host the entire product, including all data, within your private data center or public cloud accounts, ensuring no external access.

Record-level Security

You can dynamically filter rows based on user or group-specific criteria, ensuring tailored, permission-based data access within a shared dashboard.